The Engulfing Candle Stick Pattern: A Comprehensive Guide
The Engulfing Candle is one of the most powerful and widely recognized candlestick patterns in technical analysis. It serves as a strong indication of trend reversal and is often used by traders to identify potential entry and exit points. This article explores the engulfing pattern in depth, covering its types, significance, formation, trading strategies, and more.
What is an Engulfing Candle?
An Engulfing Candle is a two-candlestick reversal pattern that occurs in both bullish and bearish markets. It consists of a smaller candle (representing the initial trend) followed by a larger candle that completely engulfs the previous one. This engulfing candle signals a shift in market sentiment and often results in a trend reversal.
Key Characteristics:
- The second candle must completely engulf the body of the first candle (excluding wicks/shadows).
- It appears at the end of an existing trend (either uptrend or downtrend).
- The second candle should have significantly higher volume than the first candle.
- Works best when confirmed by other technical indicators like RSI, MACD, or volume analysis.
Types of Engulfing Candlestick Patterns
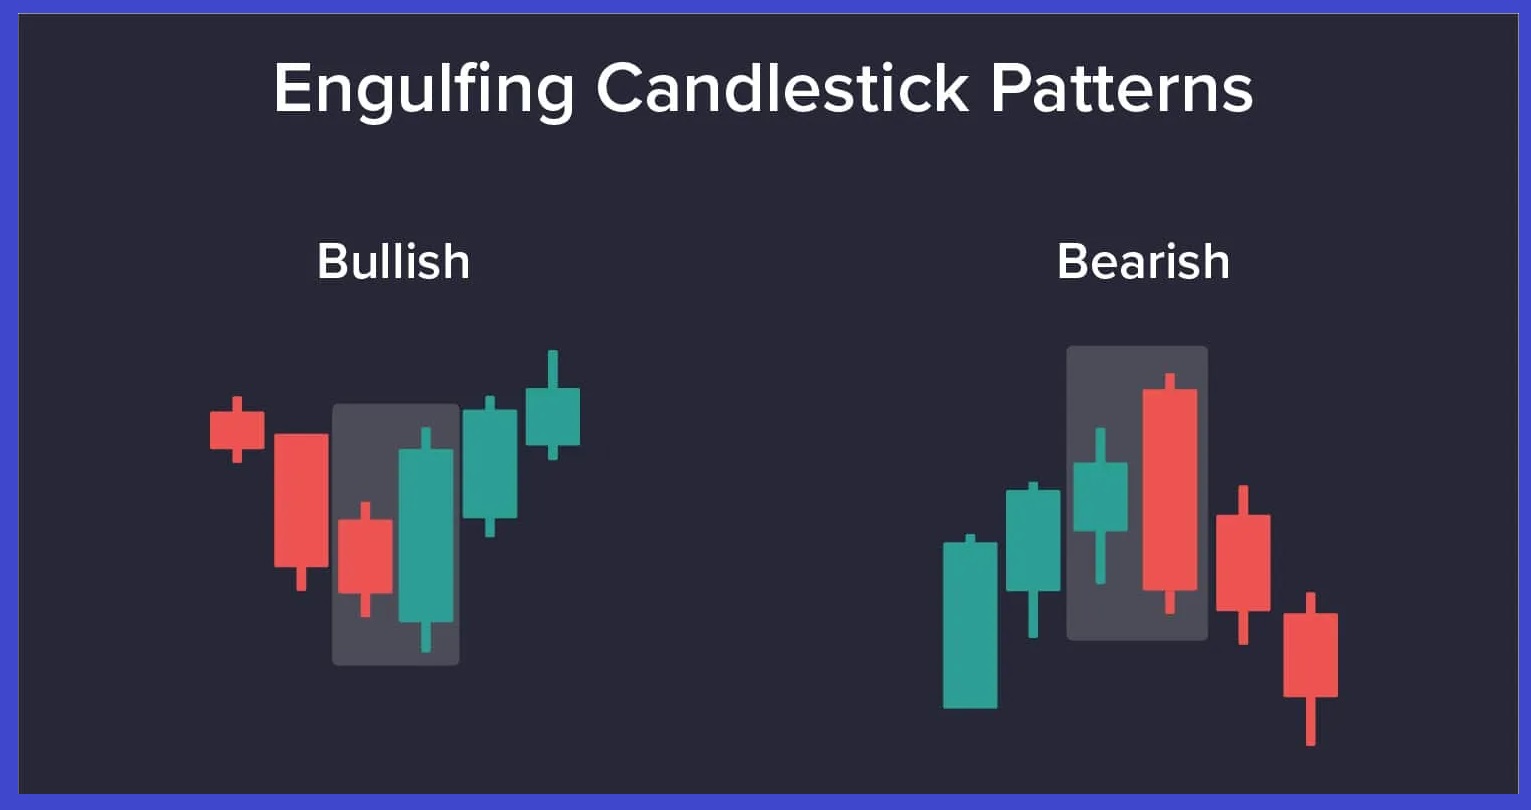
- Bullish Engulfing Pattern
A Bullish Engulfing pattern appears at the end of a downtrend and signals a potential reversal to the upside.
Formation:
- The first candle is bearish (red or black), indicating downward momentum.
- The second candle is bullish (green or white) and completely engulfs the first candle’s body.
- This pattern signifies that buyers have overwhelmed sellers, shifting the market sentiment toward bullishness.
Trading Implications:
- Entry: Enter a long position when the next candle confirms the uptrend.
- Stop-loss: Place a stop-loss below the low of the engulfing candle.
- Take-profit: Use resistance levels or Fibonacci retracement levels to set profit targets.
- Bearish Engulfing Pattern
A Bearish Engulfing pattern appears at the end of an uptrend and signals a potential reversal to the downside.
Formation:
- The first candle is bullish (green or white), showing continued upward momentum.
- The second candle is bearish (red or black) and completely engulfs the first candle’s body.
- This pattern indicates that sellers have taken control, pushing the price lower.
Trading Implications:
- Entry: Enter a short position when the next candle confirms the downtrend.
- Stop-loss: Place a stop-loss above the high of the engulfing candle.
- Take-profit: Use support levels or Fibonacci extensions for profit targets.
Why is the Engulfing Pattern Important?
- Trend Reversal Indicator:
- It signals a potential change in market direction, helping traders anticipate future price movements.
- High Reliability:
- When combined with volume analysis and other indicators, engulfing patterns provide strong signals.
- Works Across Timeframes:
- Useful for intraday, swing, and long-term trading strategies.
- Applicable in Various Markets:
- Found in stocks, forex, commodities, and cryptocurrency markets.
How to Trade Using the Engulfing Pattern?
Step 1: Identify the Trend
Before taking a trade, determine whether the market is in an uptrend or downtrend. The pattern should occur at key support or resistance levels for greater accuracy.
Step 2: Confirm with Volume
A significant increase in volume on the second (engulfing) candle strengthens the pattern’s reliability.
Step 3: Use Additional Indicators
Combine the engulfing pattern with indicators like:
- Relative Strength Index (RSI): To confirm overbought or oversold conditions.
- Moving Averages: To determine trend direction.
- Bollinger Bands: To assess volatility.
- MACD: To confirm momentum shifts.
Step 4: Place Stop-Loss and Target
- Set a stop-loss below the low (for bullish engulfing) or above the high (for bearish engulfing).
- Determine profit targets based on previous resistance/support levels or Fibonacci retracements.
Step 5: Wait for Confirmation
Do not enter a trade immediately after spotting an engulfing pattern. Wait for the next candle to confirm the new trend direction.
Real-Life Examples of Engulfing Patterns
Example 1: Bullish Engulfing in a Stock Uptrend
- Suppose XYZ Ltd. has been in a downtrend for weeks.
- A bullish engulfing candle forms at a key support level with high volume.
- The next candle confirms the uptrend, and the stock begins to rally.
Example 2: Bearish Engulfing in a Crypto Market
- Bitcoin (BTC) is in a strong uptrend.
- A bearish engulfing pattern appears at a resistance level.
- The next candle breaks below support, confirming the trend reversal.
Common Mistakes Traders Make
- Ignoring Volume:
- An engulfing candle without significant volume may lead to false signals.
- Trading in Consolidation Phases:
- Engulfing patterns are more reliable in trending markets.
- Neglecting Confirmation:
- Entering trades without waiting for trend confirmation can result in losses.
- Using Only One Indicator:
- Relying solely on engulfing candles without additional technical analysis may lead to incorrect decisions.
Conclusion
The Engulfing Candle pattern is a powerful tool for identifying trend reversals in financial markets. When used correctly with volume confirmation and other indicators, it can significantly improve trading accuracy. Whether you’re trading stocks, forex, or crypto, mastering this pattern can give you an edge in making informed trading decisions.
By following proper risk management strategies and combining engulfing patterns with other technical tools, traders can optimize their success and minimize risks in volatile markets. Happy trading!
Stock Market Academy is the leading institute for stock market courses, offering expert training in technical analysis, intraday trading, options trading, and more. With experienced mentors, practical market sessions, and flexible online & offline courses, the academy equips students with real-world trading skills. Recognized for its comprehensive curriculum and hands-on approach, Stock Market Academy is the top choice for aspiring traders and investors.